Web maps exhibit
Techstack
- Python, Mapbox, JavaScript
Tools
- QGIS, Mapbox Geocoding API, Geoserver
Review of different web maps I've made
This is simply a display of a few web maps that I've created. The majority of them were developed using the Leaflet.js library for web mapping. Each project is modest in size and simplicity, as I didn't use any databases, but simple GeoJSON files. The base maps, consisting of raster tiles, are acquired from publicly available sources.
-
Isochrones analytics map. I did this isochrone analysis using pgRouting and QGIS. I also wrangled demographics data and several sources of data from education services and bus routes, all to be displayed on this webmap.
-
Pools detection map using deep learning. This was made to showcase the result of a deep learning algorithm for pool detection using aerial photographs. It includes raster data hosted on a Geoserver instance, and a CSS-based sidebar to show/hide the layers controls'.
-
Simple parcel map with metadata in a box. Click on the parcel to update metadata.
-
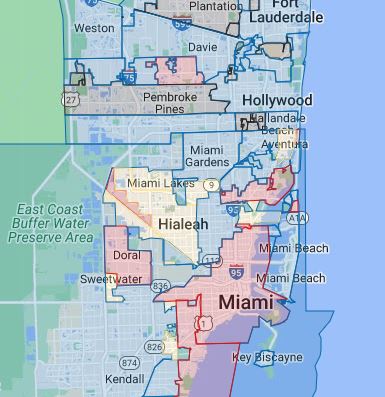
Miami regulation map. It has a search bar to look up for addresses, pointing to Mapbox Geocoding API. However, it's not functional to avoid possible charges (It's not a free API!).
-
Los Angeles asthma danger map. Hexagonal grid with scores of asthma vulnerability.
-
Montevideo's median prices of built square meter. The data was scrapped from a real state website.
-
Isochrones from center point. Isochrones were made using QGIS and QNEAT plugin.